Whole Genome Data
AMP PD includes whole genome sequencing data for most study participants. All sequencing was performed by Macrogen and the Uniformed Services University of Health Sciences (USUHS) using the Illumina HiSeq XTen sequencer with samples coming from whole blood.
Quality control of sequenced data was performed by Hampton Leonard and Hirotaka Iwaki from Datatecnica as part of a contract with the Laboratory of Neurogenetics (NIA).
Processed WGS Totals for PD Cases and Controls
| PD Case | Control (Asymptomatic Individuals) | Others | All Enrollment Types | ||||
|---|---|---|---|---|---|---|---|
| With Known Mutations | No Known Mutations | With Known Mutations | No Known Mutations | With Known Mutations | No Known Mutations | Unknown Mutation Status | |
| BioFIND | 24 | 75 | 22 | 48 | 2 | 1 | 0 |
| HBS | 204 | 435 | 146 | 385 | 0 | 3 | 7 |
| LBD | 0 | 0 | 541 | 1424 | 1367 | 1247 | 0 |
| LCC | 181 | 61 | 203 | 154 | 0 | 0 | 0 |
| PDBP | 278 | 573 | 145 | 370 | 38 | 111 | 6 |
| PM | 0 | 0 | 0 | 0 | 0 | 0 | 100 |
| PPMI | 605 | 352 | 583 | 173 | 83 | 53 | 2 |
| SURE-PD | 90 | 169 | 0 | 0 | 0 | 0 | 0 |
| STEADY-PD3 | 101 | 227 | 0 | 0 | 0 | 1 | 0 |
| Total | 1483 | 1892 | 1640 | 2554 | 1490 | 1416 | 115 |
WGS Known Sample Mutations
GBA: N370S (rs76763715); T369M (rs75548401); E326K (rs2230288)
LRRK2: G2019S (rs34637584); R1441G_T (rs33939927); R1441G_G (rs33939927)
SNCA: A53T (rs104893877); G51D (rs431905511); E46K (rs104893875); A30P (rs104893878)
APOE: 388T_C (rs429358); 526C_T (rs7412)
| E2/E2 | E2/E3 | E3/E3 | E2/E4 | E3/E4 | E4/E4 | Unknown | |||
|---|---|---|---|---|---|---|---|---|---|
| 44 | 1122 | 6205 | 213 | 2563 | 328 | 115 | |||
| PD | 1521 | Case | 5 | 100 | 532 | 14 | 185 | 15 | 3 |
| Control | 2 | 78 | 307 | 15 | 107 | 6 | 3 | ||
| Other | 0 | 26 | 94 | 3 | 24 | 2 | 1 | ||
| PP | 1851 | Case | 7 | 121 | 611 | 19 | 185 | 14 | 1 |
| Control | 7 | 98 | 487 | 14 | 143 | 7 | 1 | ||
| Other | 0 | 13 | 87 | 5 | 29 | 2 | 0 | ||
| PM | 100 | Case | 0 | 0 | 0 | 0 | 0 | 0 | 75 |
| Control | 0 | 0 | 0 | 0 | 0 | 0 | 25 | ||
| Other | 0 | 0 | 0 | 0 | 0 | 0 | 0 | ||
| BF | 172 | Case | 2 | 8 | 73 | 1 | 13 | 2 | 0 |
| Control | 8 | 9 | 40 | 2 | 18 | 1 | 0 | ||
| Other | 0 | 0 | 1 | 0 | 1 | 1 | 0 | ||
| HB | 1180 | Case | 1 | 85 | 389 | 12 | 145 | 7 | 1 |
| Control | 4 | 68 | 333 | 9 | 110 | 7 | 6 | ||
| Other | 0 | 0 | 3 | 0 | 0 | 0 | 0 | ||
| LB | 4579 | Case | 0 | 0 | 0 | 0 | 0 | 0 | 0 |
| Control | 4 | 179 | 1305 | 17 | 424 | 36 | 0 | ||
| Other | 5 | 192 | 1200 | 85 | 920 | 212 | 0 | ||
| LC | 599 | Case | 1 | 31 | 152 | 4 | 52 | 2 | 0 |
| Control | 0 | 48 | 224 | 3 | 81 | 1 | 0 | ||
| Other | 0 | 0 | 0 | 0 | 0 | 0 | 0 | ||
| SY | 329 | Case | 4 | 44 | 208 | 7 | 59 | 6 | 0 |
| Control | 0 | 0 | 0 | 0 | 0 | 0 | 0 | ||
| Other | 0 | 0 | 1 | 0 | 0 | 0 | 0 | ||
| SU | 259 | Case | 2 | 22 | 158 | 3 | 67 | 7 | 0 |
| Control | 0 | 0 | 0 | 0 | 0 | 0 | 0 | ||
| Other | 0 | 0 | 0 | 0 | 0 | 0 | 0 | ||
Additional participant variant data is now available in AMP PD Tier 2 data identifying the APOE genotype for all AMP PD participants. Apolipoprotein (Apo) E is produced under the direction of the APOE gene and is one of five main types of blood lipoproteins (A-E). AMP PD has evaluated participant’s WGS data to determine what combination of APOE forms (genotype) is present. The APOE gene exists in three different forms (alleles) – e2, e3, and e4 – with e3 being the most common allele, found in 60% of the general population.
AMP PD’s public dataset includes 3,095 participants with at least one copy of the APOE E4 gene, and 327 participants with two copies.
Data Processing
Data processing was performed on the Google Cloud Platform. All data processing was performed against Build 38 of the Human Genome reference (GRCh38DH, 1000 Genomes Project version).
Single Sample Processing
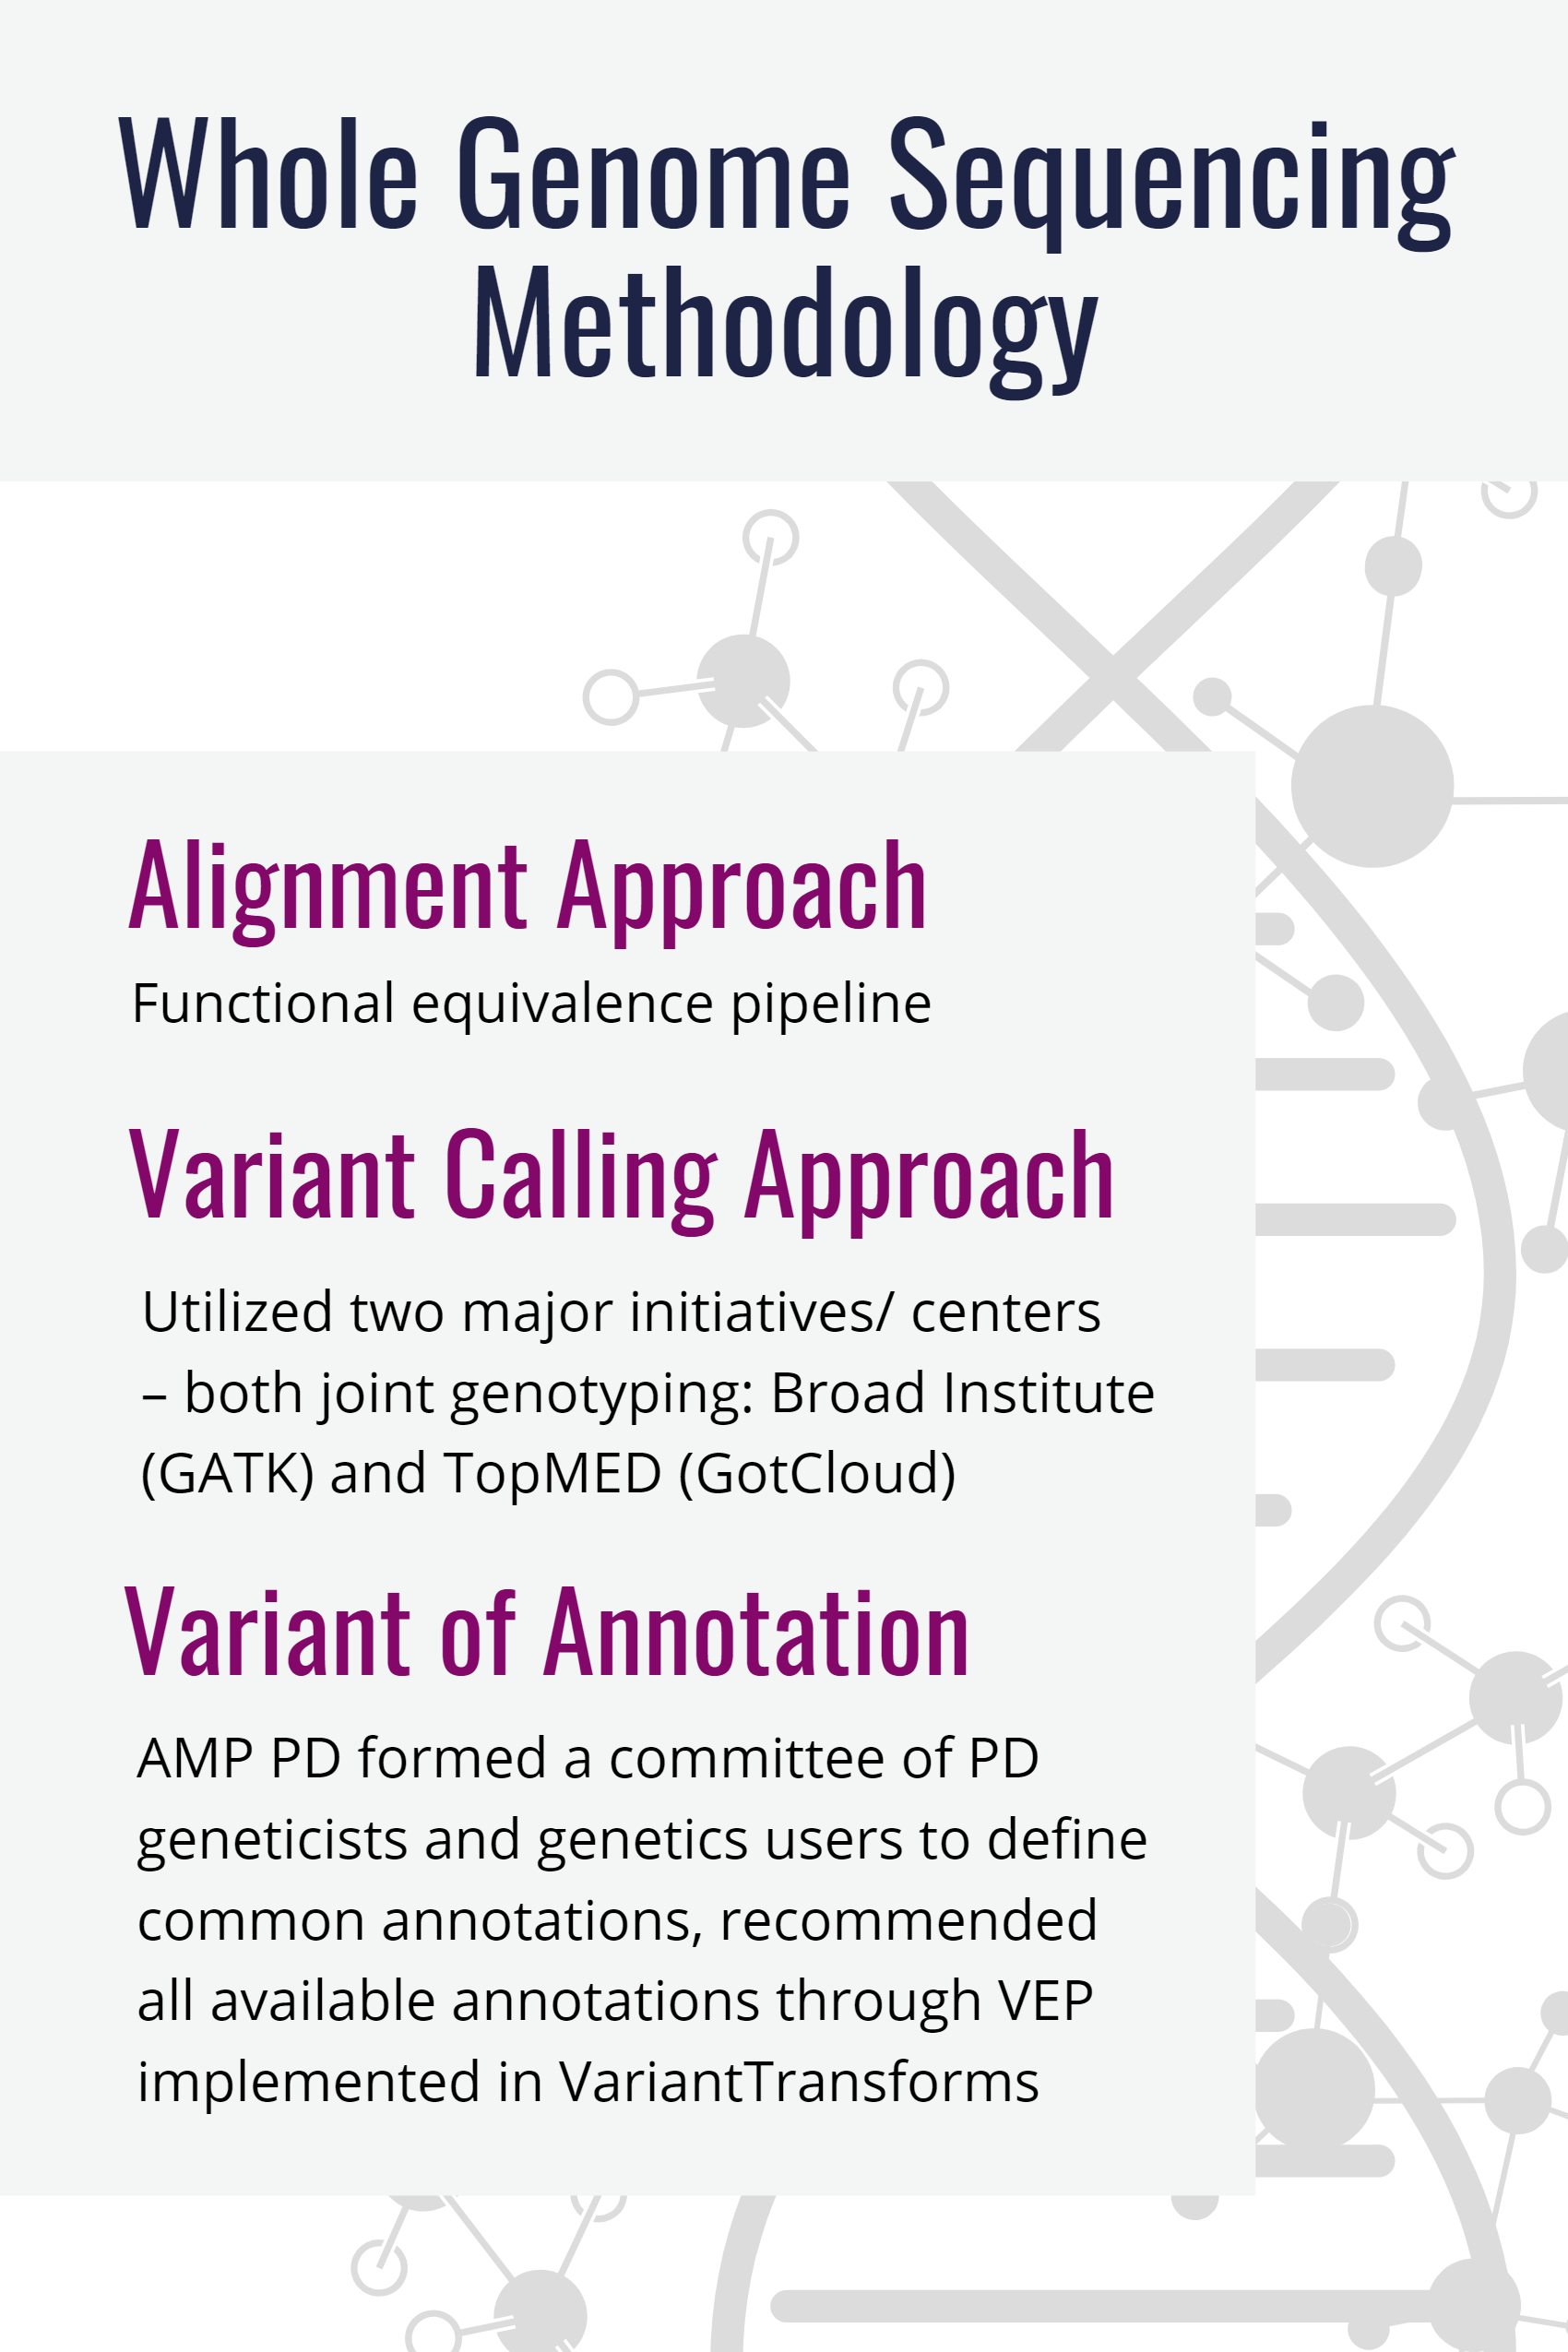
FASTQs were processed using the Broad Institute's implementation of the Functional Equivalence Pipeline to produce alignments (output as CRAM files) and variant calls (output as gVCF files).
Joint Genotyping
After single sample processing was completed joint genotyping, using the Broad Institute's Joint Genotyping pipeline, was performed on the gVCF files.
Variant Annotations
Variant annotations add variant identifiers and gene identifiers as annotations. The annotation fields can be seen on the WGS Variant Effect Predictor Fields page. Annotations were generated on the joint genotyped variants using the Variant Effect Predictor (VEP).
WGS Data Dictionary
If you want to download a version of the full AMP PD Whole Genome Sequencing Data Dictionary, click one of the buttons below for a specific format.
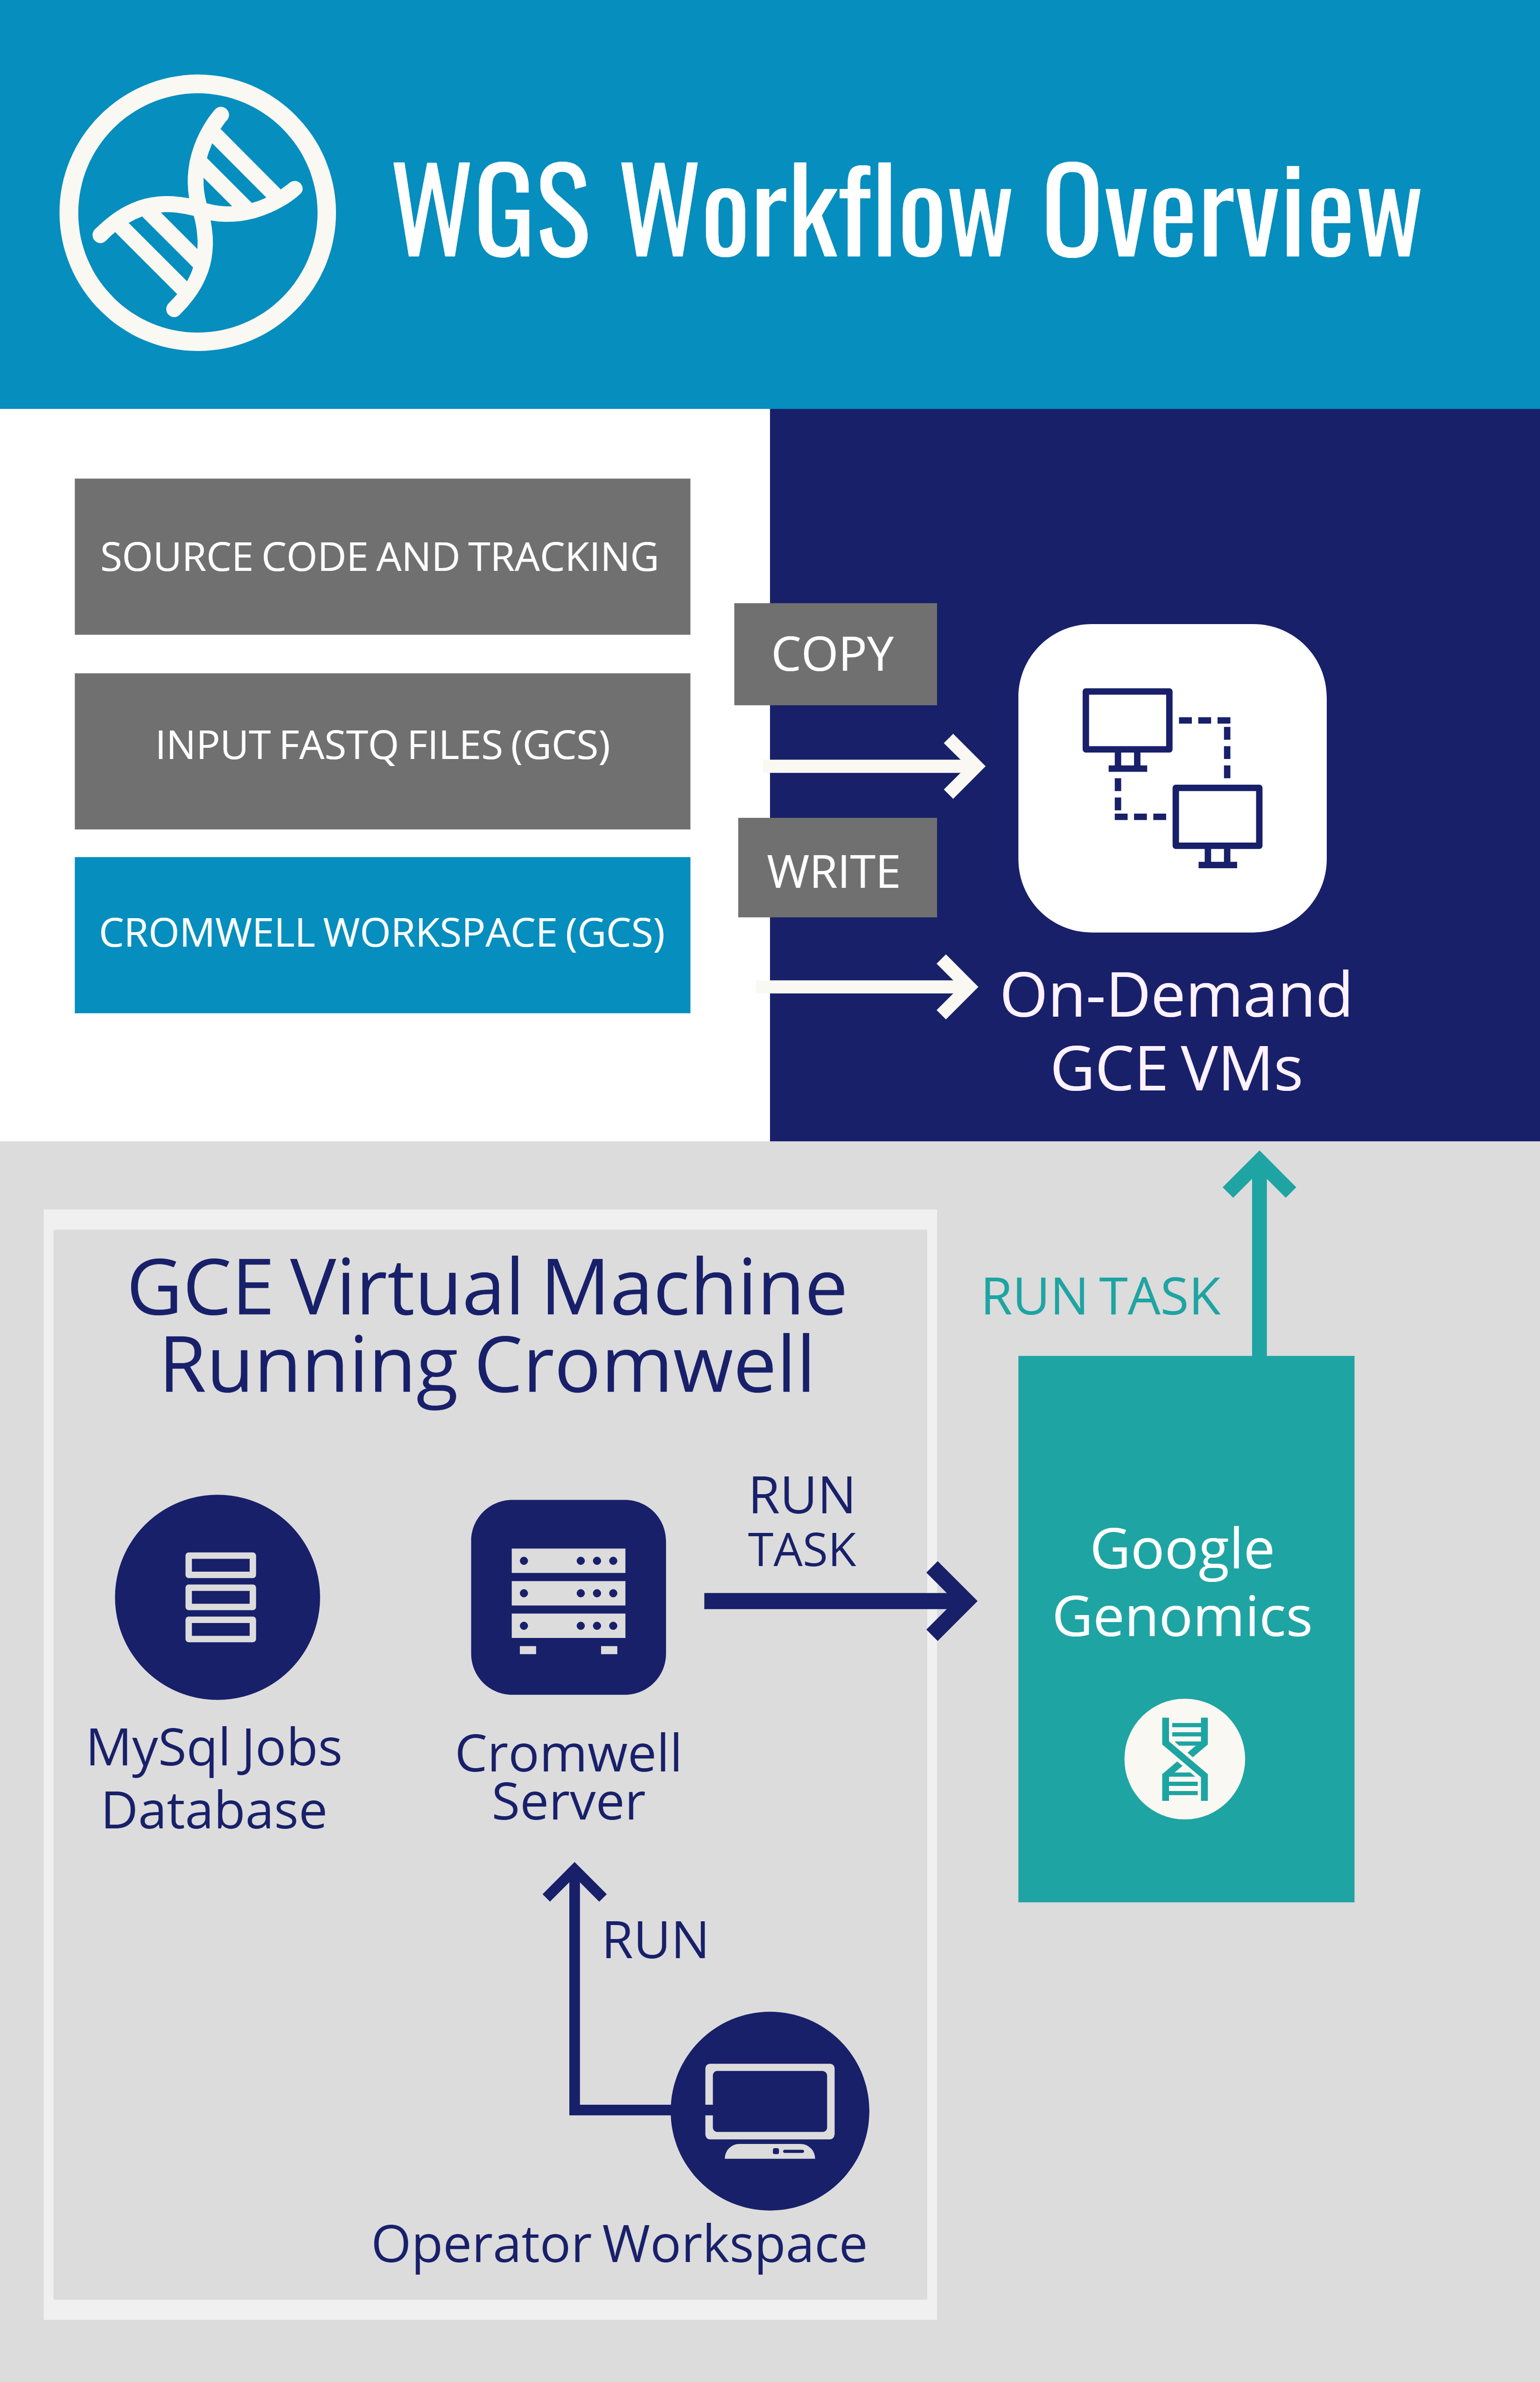
WGS Workflow Overview & Execution
Cromwell: execution engine from the Broad institute. Runs workflows written in the workflow definition language (WDL)
MySQL: database of submitted, running, and completed jobs
Cromwell Workspace: Directory in Google Cloud Storage used by Cromwell to communicate with workflow tasks
Pipelines API: The following steps detail the process of turning FASTQs into CRAMs and gVCFs using two workflows from the Broad:
- Operator submits workflow request to Cromwell on a REST API - listening on port 8000
- Cromwell creates a subdirectory in gs://<bucket/cromwell_executions for each workflow
- Repeat until workflow completes
- Cromwell creates task-specific directories in the workflow directory and populates it with the script to run
- Cromwell calls the Pipelines API to launch a VM to run the step
- Pipelines API downloads input files, executes the task, and writes outputs back to the task-specific directory in the workflow.
- Cromwell gets "job status" information both from the Pipelines API and the task-specific directory of the workflow
- Operator copies outputs to "final" location
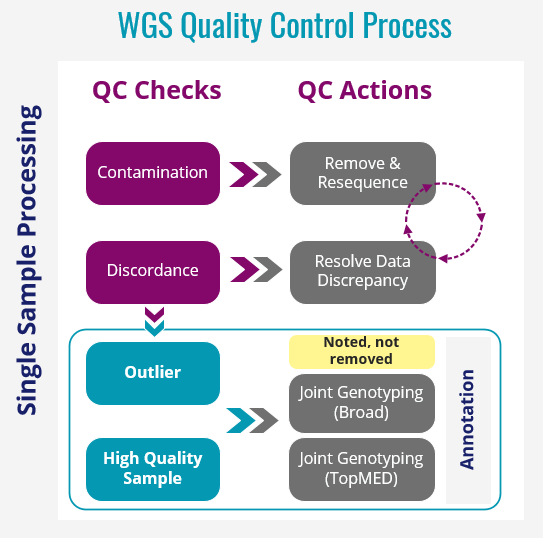
WGS Quality Control Process
Hampton Leonard and Hirotaka Iwaki from Datatecnica have performed QC analysis on 10,418 AMP PD WGS samples. This analysis has included:
- Sample Quality
- Contamination (Freemix < 3%)
- Coverage (Mean coverage < 25)
- WGS metric outliers (TiTv < 2)
- Missingness (missingness genotype rates per sample > 5%)
- Genetic Data Checks
- Duplication check
- Concordance against NeuroX data
- Clinically reported sex
- Excessive heterogeneity
- Clinically reported race/ethnicity
Sample Quality Checks
- Contamination - Some samples show clear signs of contamination as reported by VerifyBAMId. Contaminated samples were removed from AMP PD.
Pass/Fail Criteria: VerifyBamID FREEMIX >= 0.03 - Read Coverage - In sequencing experiments, some samples may have low mean coverage. Outliers identified by this QC criteria were excluded from joint calling and flagged for wet laboratory follow-up.
Pass/Fail Criteria: Mean_Coverage >= 25 reads per variant - WGS metric outliers - Low transition transversion ratio (TiTv)
Pass/Fail Criteria: Failing samples at values < 2 based on dbSNPs - Missingness - Refers to missing genotype rates per sample
Pass/Fail Criteria: Sample with > 0.05% missingness
Genetic Data Checks
- Duplication check - Some samples matched their NeuroX data, but also matched another WGS sample (which matched its NeuroX data). This indicates that the same individual has been included in AMP PD more than once. Some samples had no NeuroX data to match against, but matched another WGS sample. This indicates that either the same individual has been included in AMP PD, or one of the samples was mislabeled. The higher quality WGS samples were used in joint genotyping and the lower quality WGS samples were made available in AMP PD, but not in joint genotyping.
Pass/Fail Criteria: Software King Relatedness = dup/MZTwi - Concordance against NeuroX data - For some samples, there was NeuroX data available, but the WGS sample did not match this NeuroX data based on rates of genotype concordance. The WGS data is a superset of the NeuroX data, so samples with only WGS were not included in this phase of analysis. Discordant samples were removed from AMP as this suggests a problem with the DNA itself.
Pass/Fail Criteria: Software King Relatedness !=dup/MZTwin - Clinically reported sex - Sex estimated from WGS was checked against data from self-report. Discordant sex suggests a sample mix-up generally. These samples were removed from joint calling and the biological data used for the assay and further assays were flagged for caution going forward.
Pass/Fail Criteria: M=F or F=M, Blanks ignore - Excessive heterogeneity - Computes observed and expected autosomal homozygous genotype counts for each sample, and reports method-of-moments F coefficient estimates (i.e. (<observed hom. count> - <expected count>) / (<total observations> - <expected count>)).
Pass/Fail Criteria: F > +/- 0.15 - Clinically reported race/ethnicity - Samples for subjects who reported white and are admix or reported multiracial and are genetically European. Ancestry outliers are determined using PCA and comparing to hapmap samples. Any sample within a distribution of plus/minus 6 standard deviations from the mean in PC1 and PC2 are considered to be part of that population genetically.
Excluded Flagged Genetically inferred African or Asian = clinically reported “white” Genetically inferred Admix = anything other than “mixed race” Genetically inferred European = clinically reported “african/asia” Clinically reported “unknown”