AMP PD Harmonized Data

Release 2.5 Data
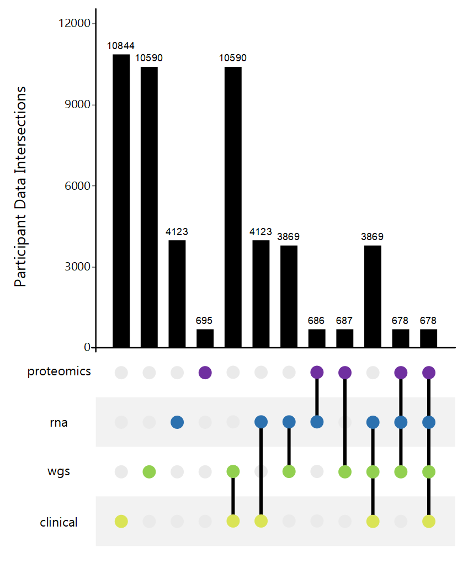
AMP PD's current public data set includes 10,844 participants from eight cohorts. This graph depicts the number of subjects with each data type. More Info.

AMP PD generates and consolidates data from eight unified cohorts (BioFIND, HBS, LBD, LCC, PDBP, PPMI, STEADY-PD3 and SURE-PD3). Data was generated using standardized technology and centrally harmonized and quality controlled. All data was generated from samples collected under similar protocols.

This data harmonization process and single data use policy facilitates and simplifies cross-cohort analysis.

AMP Harmonized Data includes, but is not limited to:

  • Clinical Data
    • Demographic
    • Enrollment
    • Medical History
    • MDS-UDPRS
    • MoCA
    • UPSIT
  • Transcriptomic Data
    • RNASeq from whole blood
    • Illumina Novaseq sequencing
    • Gencode v29 reference
  • Genomic Data
    • Whole Genome Sequencing from whole blood
    • Illumina XTen sequencing
    • Human Genome hg38 reference
  • Proteomic Data
    • Targeted proteomics from CSF and plasma
    • Olink Explore analysis
    • Untargeted proteomics
  • Single Nucleus Brain Data
    • Clinical Data
    • Whole Genome Sequencing
    • Single Nucleus RNA Sequencing

AMP PD Harmonized Genome Data At-A-Glance

Whole Genome Data

All Whole Genome Sequencing (WGS) was performed by Macrogen and the Uniformed Services University of Health Sciences (USUHS) using the Illumina HiSeq X Ten sequencer with samples coming from whole blood. AMP PD has released joint genotyping data that includes BioFIND, HBS, LBD, LCC, PDBP, PPMI, Steady PD, and SURE PD and totals more that 10,000 samples.

Data processing was performed on the Google Cloud Platform and in Terra. All data processing was performed against Build 38 of the Human Genome reference (GRCh38DH, 1000 Genomes Project version).

  • Single sample alignment and variant calling was performed using the Broad Institute's Functional Equivalent Workflow (definition) to produce alignments and variant calls.
  • Joint genotyping was performed using the Broad Institute's joint discovery workflow (definition)
  • Annotations to add variant identifiers and gene identifiers were generated on the joint genotyped variants using the Variant Effect Predictor (VEP).

Extensive quality control checks were performed on the samples and on the genetic data derived from them.  Samples that were contaminated, as reported by VerifyBAMId, samples with low transition transversion ratio (TiTv), and samples with high missing genotype rates were removed from AMP PD.  Samples with low mean coverage were excluded from joint calling and flagged for wet laboratory follow-up.

Samples were also checked to ensure that genetic data matched expectations based on clinical and other genetic data.  Samples were matched against WGS sample data and NeuroX platform data for the same individual and for other individuals to identify duplicates and mismatched samples.

WGS data made available includes:

  • Single Sample CRAM, gVCF, and metrics files
  • Joint Genotyping VCF and PLINK files
  • Joint Genotyping results using the TopMED GotCloud pipeline

AMP PD Harmonized Transcriptomics Data At-A-Glance

Transcriptomics Data

AMP PD has Bulk RNA Fastq and workflow products from Salmon, Star, Picard metrics and Feature Counts for BioFIND, PDBP, and PPMI cohorts. All RNA Sequencing was performed by Hudson Alpha at 150 base pairs on the Illumina NovaSeq 6000 with samples coming from whole blood.  Data processing was performed on the Google Cloud Platform and in Terra. All data processing was performed against Gencode v29.  In addition to Quality Controls provided by Hudson Alpha, AMP PD performed concordance testing for all RNA Seq data against clinical data and whole genome sequencing data where available.

Transcript abundance was estimated using two pipelines. First, Transcripts Per Million (TPMs) were generated using the Salmon pipeline directly from FASTQ files on Gencode29. Second, counts per gene were generated by counting aligned reads from STAR generated BAMs onto Build 38 of the Human Genome reference.

As part of the RNASeq QC process, testing was done to check for concordance with other data, to check for mismatched samples, and to check for duplicate samples.  For concordance checking, a sex check was used during processing of samples to ensure that at a coarse level, samples were properly identified.  Additionally, RNA samples were checked for concordance against WGS samples and other RNA samples for duplicates and mismatched samples. AMP PD Quality Control processes, including PCA and t-SNE analyses are documented in Terra workspace notebooks that are released and can be executed by the AMP PD Community.

RNASeq data released by AMP PD includes:

  • Salmon TPM files
  • STAR aligned BAM files
  • Subread featureCounts files
  • Picard metrics files

AMP PD Harmonized Proteomic Data At-A-Glance

Targeted Proteomics Data

Targeted proteomics analysis was conducted on cerebrospinal fluid and blood plasma of both Parkinson's Disease patients and healthy participants in the PPMI cohort. Analysis was conducted using Olink Explore which uses a pair of tagged antibodies per specified protein and amplification in a Proximity Extension Assay (PEA) for measuring relative protein abundance via double-stranded DNA molecules. The method requires sequencing data to be converted into normalized protein expression (NPX) values to be used in downstream analysis. NPX data is then intensity normalized and undergoes extensive quality control using the different assay controls before proceeding with analysis.

Participant samples were selected from participants who had previously generated corresponding Whole Genome Sequencing and/or Transcriptomic data on the AMP PD Knowledge Platform.  Only samples with three or more timepoints available were selected.  All CSF samples selected had hemoglobin < 100 ng/mL to assure limited blood contamination, and all Plasma and CSF samples were collected under similar protocols.

In order to control and assess technical performance of the assay at each step, ensuring generation of reliable data, extensive quality control procedures were followed.  Controls were added as follows:

  • Three internal controls were added to each sample to monitor the quality of assay performance, as well as the quality of individual samples: an Incubation Control, an Extension Control, and an Amplification Control.  
  • Three external controls were added to each plate to normalize data and also monitor assay performance: a Sample Control of pooled plasma, a negative control, and a plate control of pooled plasma.

Utilizing internal controls, each sample in a block is given the status “PASS” or “WARN”, based on the sample’s incubation control deviation, amplification control deviation, and minimum average counts.

To determine the relative abundance of targeted proteins, a proximity extension assay is performed. A pair of antibodies that bind to a protein of interest contain unique sequences that are extended, amplified and subsequently detected and quantified by NGS.  The raw output data is NGS counts, where each combination of an assay and sample is given an integer value based on the number of DNA copies detected. These raw data counts are converted into Normalized Protein Expression (NPX), which quantifies the relative amount of a specific protein and are used for subsequent downstream analysis.

NPX is calculated by dividing the assay counts of a sample by those of the extension control for that sample and then undergoing a log2 transformation. Subsequent intensity normalization is performed by between-plate-normalization.

Resulting data after processing and QC shows NPX for each targeted protein for each sample within the specified assay. Within the AMP PD targeted data sets, four separate Explore 384 panels were run on each tissue type. The four separate Explore 384 panels were Neurology, Inflammation, Cardiology and Oncology. Each panel has its own specific set of targeted proteins.

Untargeted Proteomics

The untargeted proteomics datasets comprise CSF and plasma based assays that use mass spectrometry via the Orbitrap Exploris platform and Openswath target extraction software to produce raw, processed, and aggregate expression data at the fragment, protein, and peptide levels. Single sample data is available for the CSF (CSF) assay in raw and mzML formats, along with normalized batch corrected matrix data in csv formats. The plasma (PLA) assay includes native and depleted single sample and aggregate data in the same file formats. And each of CSF and PLA datasets is accompanied by a complete SDRF metadata file that includes relevant clinical data fields and instrument details.

A data table for each of CSF (CSF) and Plasma (PLA) assays identifies protein abundance per detected UniProt id for each participant sample. These are available in BigQuery and can be accessed directly through Google interfaces or through notebooks and tools in Terra.. AMP PD provides examples for how to access, retrieve, and use the untargeted proteomics data through workspaces and notebooks in Terra. Registered users can access the workspaces below, which include  Jupyter notebooks written in R and in python that can be cloned and edited to suit your needs.

AMP PD Harmonized Clinical Data At-A-Glance

Clinical Data

AMP PD harmonizes, or standardizes, similar clinical data collected across cohorts. More specifically, variable names from AMP PD studies are aligned to a global mapping file and final curation is reviewed by AMP PD; this Harmonized Dictionary, based on CDISC terminology, is available as a reference for the harmonized clinical dataset and is linked with the Harmonized Assessment and Variable Matrix. For the most part, data includes only those data elements available across all cohorts.

Data was harmonized, curated and consolidated into one dataset using automated and manual approaches. To harmonize and standardize metadata for the AMP PD project, a global mapping file (Harmonization Dictionary), aligning variables between datasets, was first created. CDISC terminology was used for harmonized variable names and descriptions when possible. A coding file was then created to decode numeric coded variables, clean-up and standardize medication names, diagnosis, level of education, etc., and align visit names between cohorts. After mapping and coding files were generated, an automated tool was applied to transform data files and perform integration of multiple, source datasets into one set of curated files. Manual inspection of transformed files followed each phase of automatic transformation. The content of each transformed file was approved by a curator and all needed adjustments were performed manually. Finally mapping files (dictionaries) for uploading data into BigQuery tables were produced by processing the content of the curated dataset using an automated script.

The automated transformation of clinical data was performed using the SmartConverter tool, developed by Rancho Bioscience. The SmartConverter performs a three-step transformation on the data:

  1. Convert data values from source-specific vocabularies to common vocabularies used across AMP PD data, utilizing a code mapping file, available [here]
  2. Transform source-specific clinical data forms into common data forms, combining and deriving fields where necessary, using a transform configuration table, available [here]
  3. Consolidate data from within and across cohorts to produce a single, harmonized set of clinical data files, as defined by a consolidation configuration table, available [here]

The AMP PD Clinical Data Harmonization (CDH) team performed additional validation tests on the results of the harmonization process, ensuring that no new errors were introduced into the clinical data as a result of the data harmonization process;  facilitating identification of records that should be excluded from the public release; and identifying a set of tests that can be run to validate additional data submission from the current AMP PD cohorts as well as future data submissions from new cohorts.

Along with other validations, the data was tested to ensure:

  • Consistency between forms
  • Consistency between visits
  • Consistency within the same visit
  • Validity of scores
  • Consistency with study arm
  • Inclusion of required fields
  • Inclusion of required forms
  • Consistency with DNA sequencing
  • Consistency of data across cohorts using GUID